
Market Monitor: October 2025
In the midst of what some may consider historic levels of uncertainty, global stocks powered to new highs once again in the third quarter. The Federal Reserve is finally in rate cutting mode again after many months of pressure from the Executive branch. Questions abound as we enter the fourth quarter of 2025. Can the Fed manage the process of bringing interest rates down while keeping a lid on U.S. inflation? Can companies and consumers adjust to a tariff environment that has no definitive path? Can strong corporate earnings and the proliferation of AI continue to attract investors even in the face of U.S. market valuations at the high end of the range? We may not get answers to these questions right away. In times of uncertainty though, the formula for long term investment success remains the same: maintain a diversified global portfolio, clarify and plan for important financial goals, and remember that change is a necessary part of progress.
3rd Quarter Highlights
- In early July, the S&P 500 Index returned to the highs of February prior to the volatility around Liberation Day, but it wasn’t done there. Three months of steady gains left the large U.S. stock benchmark up 8.1% for the quarter and 14.8% for the year.
- Not to be outdone, non-U.S. stocks continue to steal the show in what has become a familiar theme this year. The MSCI EAFE Index of non-U.S. developed stocks finished the quarter with an impressive 25.1% return for the year, and the FTSE Emerging Markets Index followed closely with a 23.8% gain.
- The increasing valuations of U.S. stocks have been a concern for many investors. As of September, stock valuations among large U.S. equities were nearing all-time highs. Stocks seem to have already priced in healthy earnings growth prospects for the next several years. Correspondingly, dividend and earnings yields are historically low. The dividend yield of the S&P 500 Index was approximately 1.19% at quarter end.
- The Bloomberg U.S. Aggregate Bond Index rose 6.1% for the year through the third quarter. Bond funds have seen substantial net inflows during 2025, potentially reflecting investor appetite for stability in portfolios while allowing them to take advantage of bond yields that are far outpacing dividend yields on stocks. For reference, the yield on a 10-year U.S. Treasury bond, often referred to as the risk-free rate, was 4.15% at the start of October.
- With inflation at 2.9% in August, the price of a basket of U.S. goods and services (CPI) is now growing slightly faster than it was when the Federal Reserve began lowing rates in November of 2024. This is concerning for some Fed governors as they ponder another rate reduction which may stimulate both economic and price growth.
- The Federal Reserve was created in the early 20th century and given a dual mandate by Congress to promote maximum employment and maintain stable prices. With employment data showing signs of stress and prices remaining resilient, all eyes will be on the Fed over the next several meetings as we look for clues about the economic path forward.
- As of this writing, the Federal government has been shut down for approximately one week due to the inability of Congress to reach an agreement on a spending bill for this term. While this will likely get resolved over the next several weeks, it serves as a reminder that volatility and uncertainty can come from any direction, and diversification in portfolios remains critical for risk management.
Three Big Things
Here we review some emerging themes that may be important for investors and their portfolios. We look at the increasing size and valuations of the largest U.S. firms, the decline in earnings yield over time, and the relationship between corporate and Treasury bond yields.
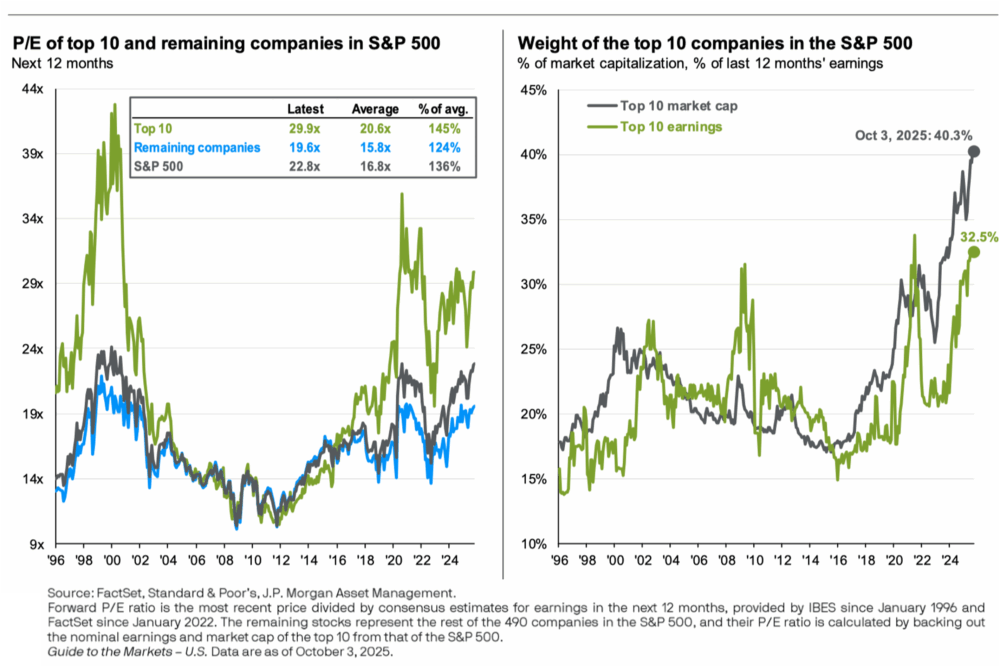
Valuations and Earnings of the Top 10 S&P 500 Companies
The increasing valuations and size representation in the index of the largest companies in the U.S. has been front and center for investors over the last several years. The most common measure of valuation, a P/E Ratio, relates the price of a company to the value of its earnings. By this measure, we are now paying more for each dollar of earnings of these companies than almost any time in recent memory. We tend to focus on the top ten companies because they represent 40% of the market capitalization and 33% of the earnings, but the valuations of the remaining 490 companies are also at elevated levels.
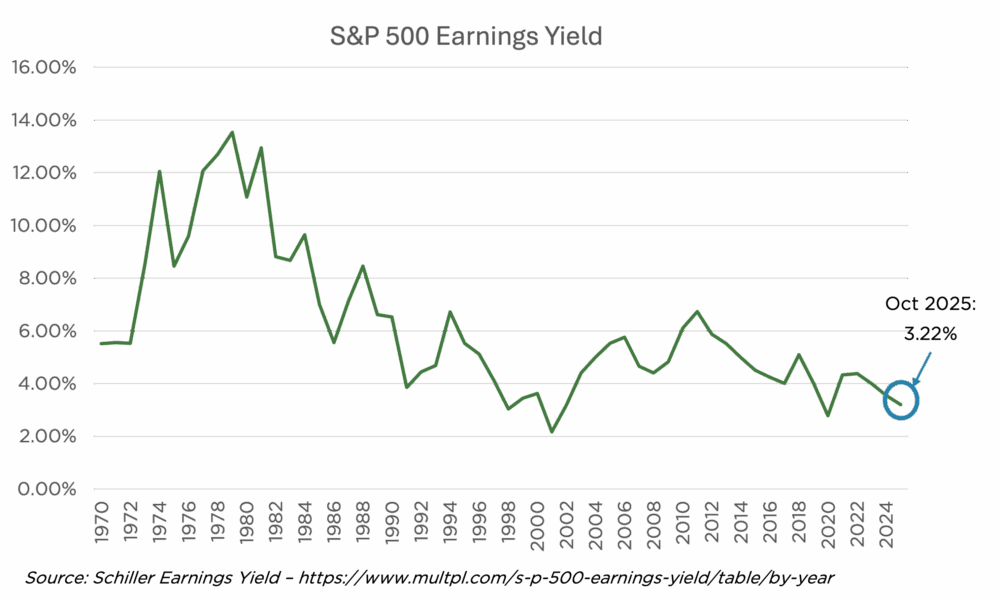
Historical Earnings Yields
Many investors are familiar with a dividend yield which relates a company’s dividends to its price. We can also learn something from the earnings yield which is the earnings divided by the price, or the inverse of the P/E Ratio. It is another measure that helps us visualize how much we are paying for the shares of a company. The chart below shows that the S&P 500 earnings yield is near the low point of the last 50 years. This is another reminder that U.S. stocks are expensive at the moment. Importantly, this is not a predictor of near-term performance as AI-driven earnings growth may be here to stay. It is simply a reminder that having a diversified global portfolio can be a great benefit to investors when it comes to risk management over time.
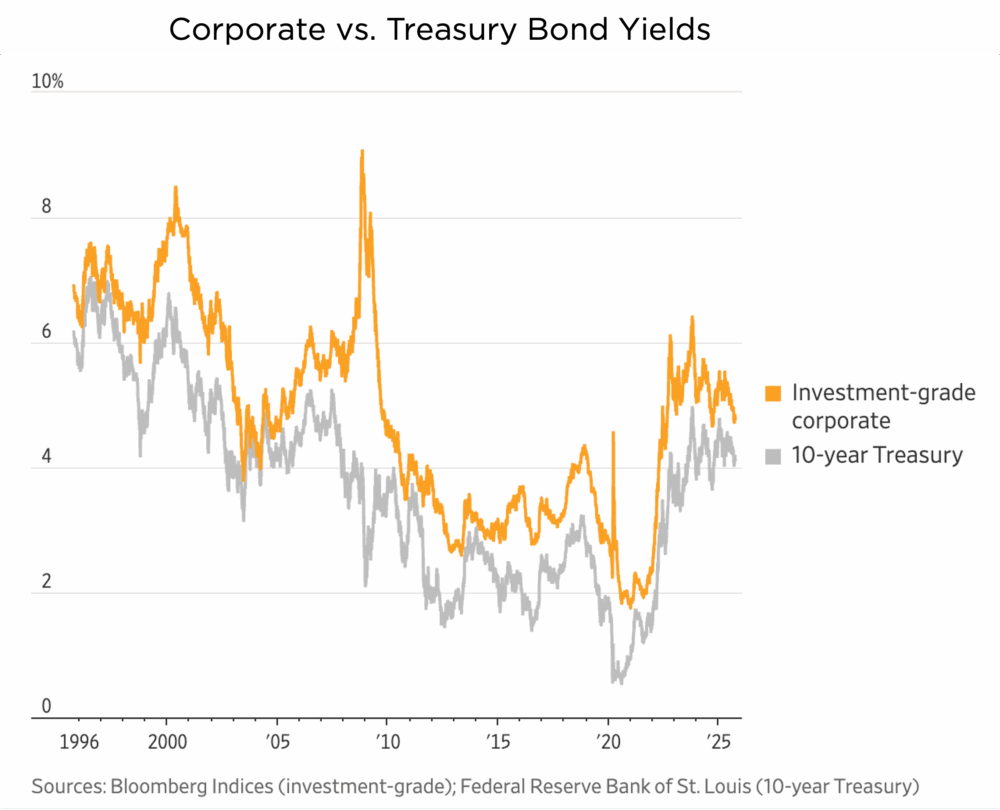
Corporate and Treasury Yields
The chart below shows the trend in yields for investment grade corporate bonds and 10-Year Treasury bonds. Corporate bonds will almost always have higher yields due to the increased risk, but over time, this differential can rise or fall based on prevailing market conditions. Today, this “spread” has fallen to relatively low levels as investors have shown a willingness to take risk by buying corporate bonds and pushing their yields lower. This has mirrored the risk-taking activity in the stock market. The yields themselves have also risen significantly from the pandemic levels of 2020, providing an attractive entry point for many investors.
We look forward to connecting with you to review your wealth management plan soon. As always, please do not hesitate to reach out to us at any time with questions or concerns.
Please find this newsletter and others on our website at www.gardecapital.com.
This article was published by Garde Capital, Inc. a Seattle based Registered Investment Advisor that provides wealth management solutions to individuals and families, nonprofit organizations, and corporate retirement plans.
Copyright 2025 by Garde Capital, Inc.