
Market Monitor: July 2024
The good times are still rolling, at least for large U.S. growth stocks. While a still inverted yield curve remains a challenge for the bond market, the relative stability of rates and inflation has kept the risk trade in place for stocks helping them finish the first half of the year near all-time highs. Economic growth continued in the second quarter of 2024, but the data is still not providing clear signs to the Federal Reserve that any move in interest rates is warranted. Investors wait with bated breath to find out if they will get any rate cuts at all this year.
2nd Quarter Highlights
- Large cap stocks continued their rally in the 2nd quarter, driven by technology names once again. The story remains the same, growth leads the way and value stocks struggle to get on track. The S&P 500 Index of large U.S. stocks finished the second quarter up 4.3%, bringing its year-to-date return to 15.3%. The Vanguard Growth ETF finished the quarter up 20.5% for the year. The Vanguard Value ETF was slightly negative in the second quarter, but still up 8.7% year-to-date.
- Small cap stocks and non-U.S. developed markets stocks both struggled to find their way in the second quarter, finishing the first half up only 1.7% (Russell 2000 Index) and 5.3% (MSCI EAFE Index), respectively.
- If you blinked in the second quarter, you may have missed any movement in the bond market. There was little change in the Bloomberg Aggregate Index as yields remained about where they started. The benchmark 10-year U.S. Treasury yield ended the quarter at 4.36%.
- The Federal Reserve has kept us waiting on any interest rate moves after seeming to indicate that we would see multiple rate cuts this year. The U.S. economy appears to be slowing at the margin, but inflation remains sticky at around 3.0%. Fed committee members seem content to keep short term rates higher for longer so long as economic growth continues and consumers keep spending.
- Money market fund investors who enjoy earning 5% annual yields with no risk may keep those bets on the table a while longer. Currently, over $6 trillion is invested these cash instruments. While a diversified, high quality bond portfolio has a similar yield with the potential for capital appreciation, investors will need more convincing that rates will decline before they make a shift.
- While the Federal Reserve is holding steady, other central banks around the world are beginning to reduce rates as their economies slow and inflation moderates. This is a bit of a deviation from historical norms as other countries tend to look to the Fed for leadership in this area.
Three Big Things
Here we review some emerging trends that may be important for investors and their portfolios. We look at the latest CPI readings, the status of the Money Supply, and the continued influence of the top 10 companies in the S&P 500 Index.
Consumer Price Index
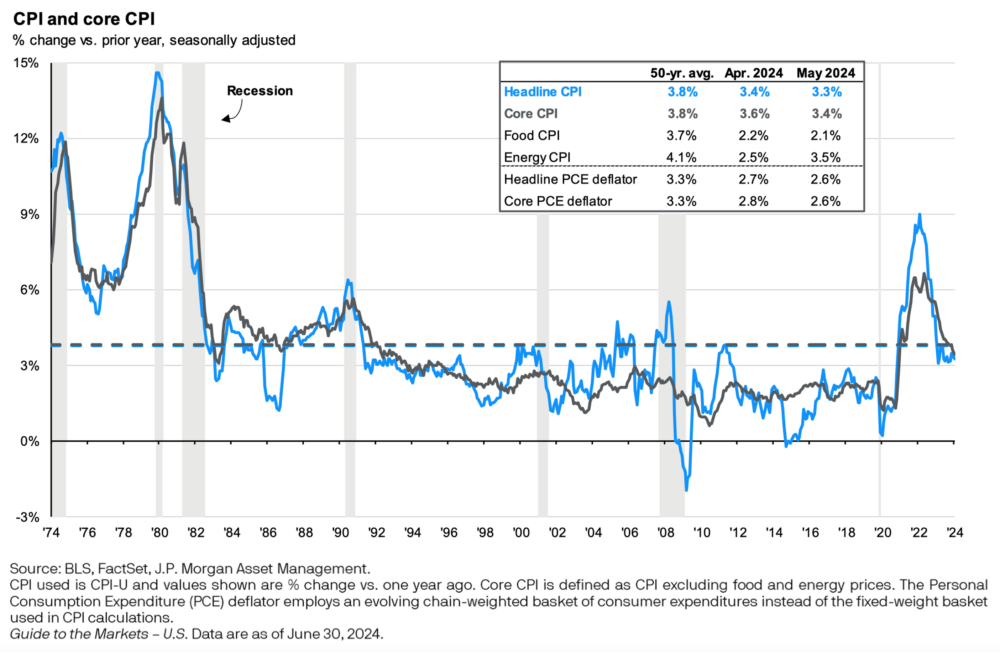
The chart below provides a historical look at the change in Core and Headline CPI. The Consumer Price Index measures the price change of a basket of goods and services in the U.S. economy. We look at both the total, or Headline CPI, and the Core CPI which excludes the impact of food and energy. Both have returned to levels that are on par with historical averages, but for much of 2024, the indicator has stagnated at just over 3%.
Money Supply
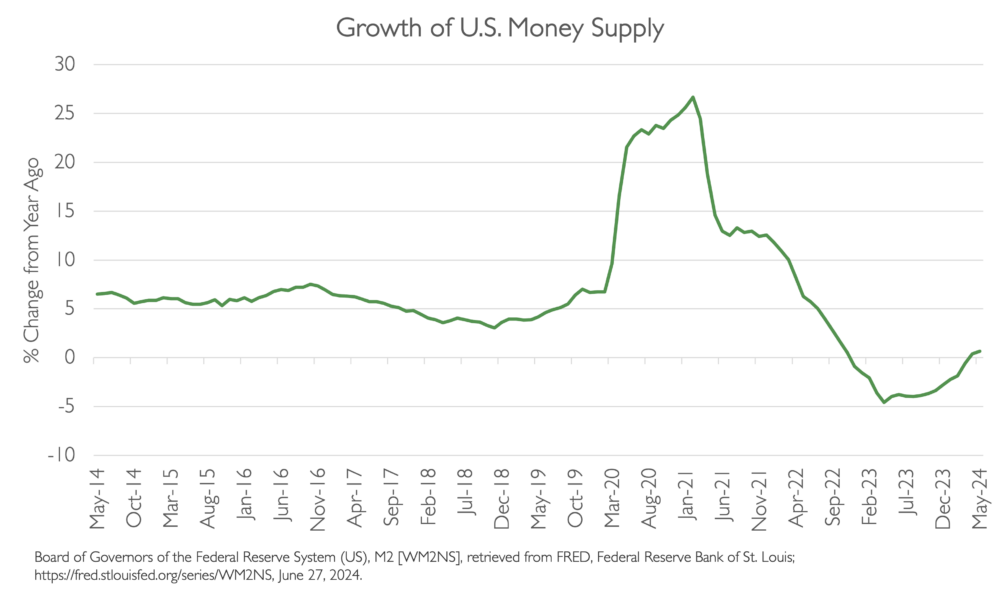
Money Supply (M2) is a measure of the total amount of money in circulation in an economy. The chart below shows the growth of M2 for the U.S. economy over time. In theory, if the supply of money (mostly managed by the Fed) increases faster than the supply of goods and services available for purchase, inflation may result. We had seen the opposite effect over the last several years as inflation declined until the beginning of 2024. The recent upward trajectory of year-over-year growth in the money supply may help us understand the persistent inflation trend that we have seen lately.
The Influence of the Top 10
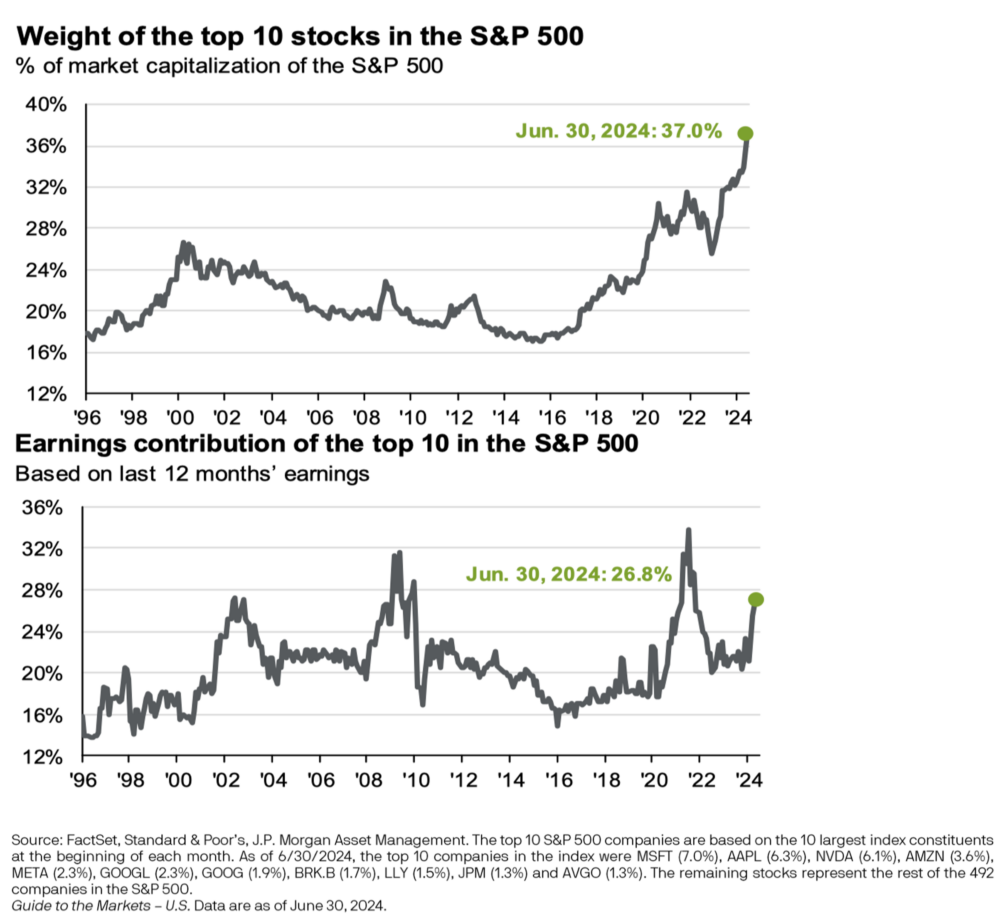
As we have discussed, the weight of the top 10 stocks in the S&P 500 Index continues to grow. These large technology companies play an increasingly significant role in the economy and attract the lion’s share of investor dollars. The charts below show the allocation of the top 10 stocks in the index over time as well as the contribution to total earnings by the top 10. We can see that while the contribution to earnings is near historical highs, the market prices of those companies have risen even faster in recent years.
We look forward to the opportunity to review your wealth management plan in the coming months. As always, please do not hesitate to reach out to us at any time.
Please find this newsletter and others on our website at www.gardecapital.com.
This article was published by Garde Capital, Inc. a Seattle based Registered Investment Advisor that provides wealth management solutions to individuals and families, nonprofit organizations, and corporate retirement plans. Copyright 2024 by Garde Capital, Inc.